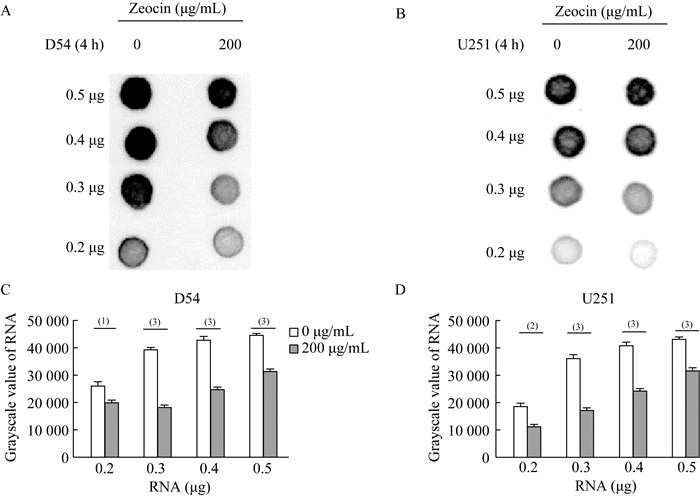
Fig 5 Zeocin decreased the m6A levels of malignant glioma cells A-B: Dot blotting assay detected the m6A level of D54 and U251 cells treated with different concentrations of Zeocin; C-D: Image J counted grayscale scan values of m6A levels in D54 and U251 glioma cells. n=3, (1)P < 0.01, (2)P < 0.001, (3)P < 0.000 1.
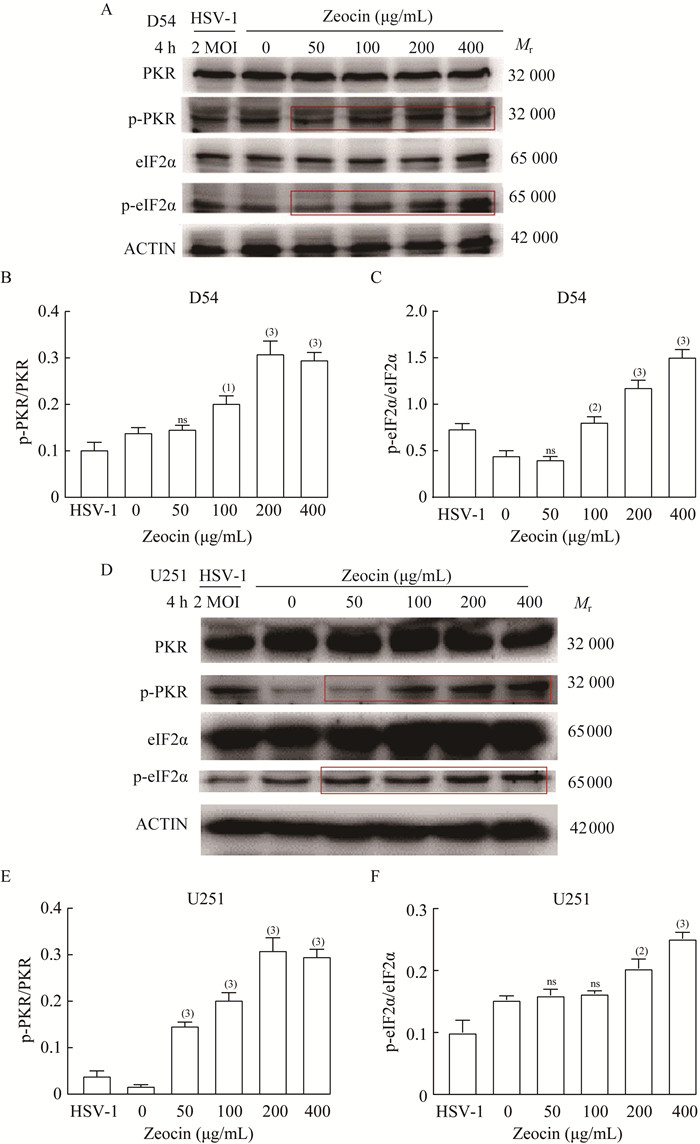
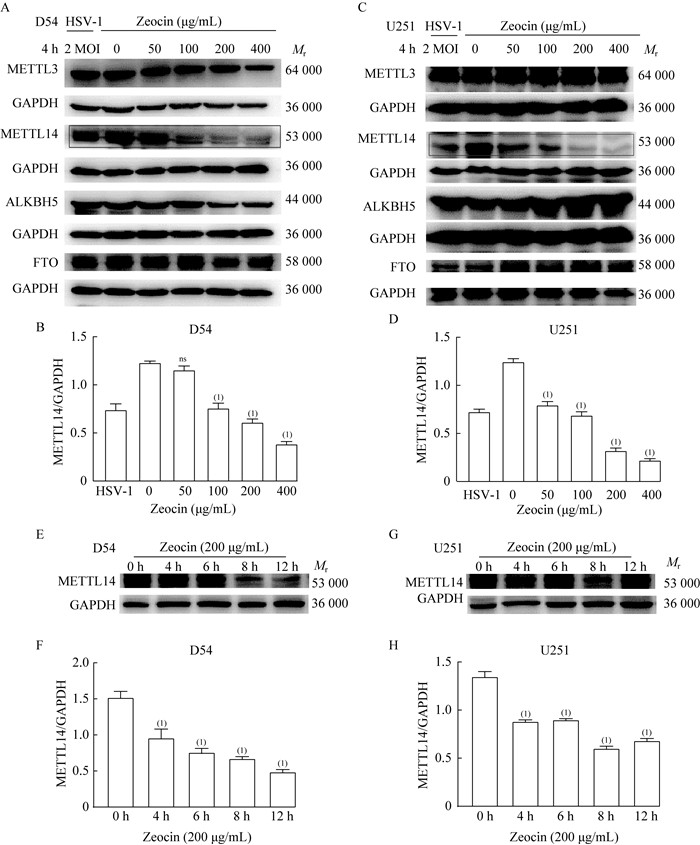
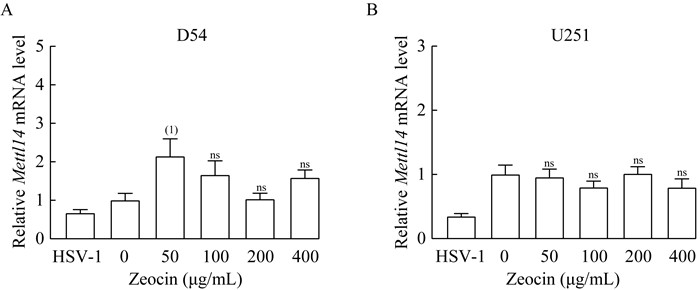
Other figure/table from this article